The Performance - Lines page gives the user a snapshot of this site's performance on a per line basis. Click each interface item in the list for details.
-
 Page Tab - Lines
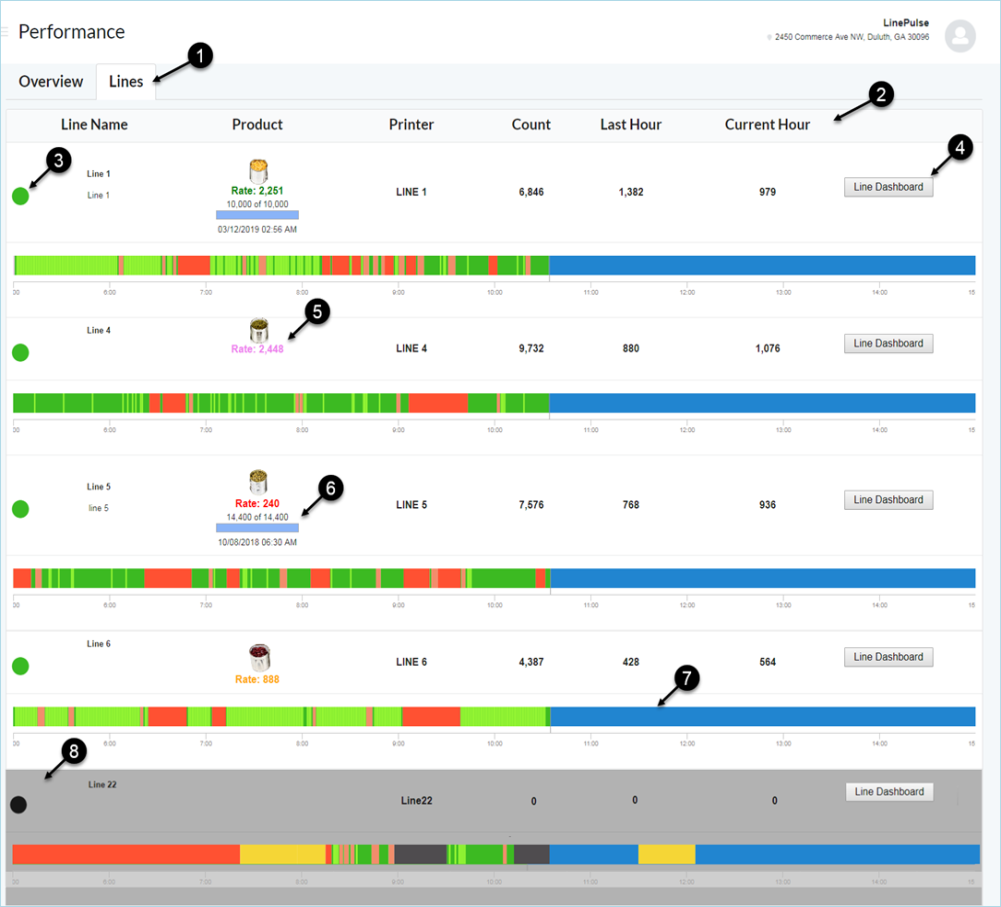
Summary of this Site's Statistics on a per Line basis.
-
Summary Columns
- Line Name: Displays Line Name and a circular icon indicating the current line status.
-
Product: Product Image of the product assigned to that line. Note: If a product is not assigned, then this column is blank.
See Product Setup - Edit a Product to add a product image.
- Printer: Designated (VRS connected) Printer Name and current status of that printer. The status information comes from VRS. See Line Setup - Edit Line to assign or change the designated printer.
- Count: Total unit count for the current shift.
- Last Hour: Unit count for the last hour of the shift.
- Current Hour: Unit count for the current hour of the shift.
-
Line Status Dots
 Green = Running, the line is operating and within a schedule shift
 Yellow = Scheduled Event, the line is stopped within a scheduled break or maintenance period
 Red = Unplanned Downtime, there have been no print counts for more than 5 minutes
 None = The line state is unknown, no dot is shown
 Black = The line is disconnected
 -
Line Dashboard Button
 Dashboard: Clicking this button will open the Line Dashboard page.
 -
Rate
Displays Run Rate as a 5-minute rolling average, projected out to a one-hour period to be consistent with how throughput targets are set and displayed. The rate display is color coded based on both Run Rate and Best Rate.
If in Downtime, run rate = 0.
Color Code Values:
- Red = rate is significantly below Target Run Rate [?]rate = 0-50% of Target Run Rate
- Orange = rate is below Target Run Rate [?]rate = 50% -99% of Target Run Rate
- Black = rate is at Target Run Rate [?]rate < [target + (best-target)/2]
- Green = rate is exceeding Target Run Rate [?]rate ≥ [target + (best-target)/2]
- Violet = rate is exceeding the Best Rate [?]rate > Best Rate
-
Product Run
Displays the current run of the selected product. To change the product on this line, see Assign a Product to a Line.
-
Shift Timeline
Shows the Shift Timeline for the current shift
Timeline color codes:
Green = Running
Light Green = Slow Cycle Running
Yellow = Scheduled Event (including Autostandby)
Red = Unplanned Downtime
Light Red= Microstop (less than 5 minutes)
Black = Disconnected (printer disconnected from VRS)
Blue = Remaining Shift.
See Shift Setup - Create an Event or Edit an Event to add or edit shift events.
-
Grayed out Line
The line will be grayed out whenever the designated (VRS connected) Printer is disconnected from VRS. The status information comes from VRS. See Line Setup - Edit Line to assign or change the designated printer.