Clicking on a selected Line's 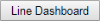 button on the Performance - Lines Summary page will open that Line's Dashboard page.
The Line Dashboard page gives the user a snapshot of this site's performance on a per line basis. Click each interface item in the list for details.
-
 Back Arrow
Click to return to the Lines Summary page.
-
Top Line
-
Icon: Displays circular icon showing the current status of that line.
 Green = Running, the line is operating and within a schedule shift
 Yellow = Scheduled Event, the line is stopped within a scheduled break or maintenance period
 Red = Unplanned Downtime, there have been no print counts for more than 5 minutes
 None = The line state is unknown, no dot is shown
 Black = The line is disconnected
 - Designated Printer: Printer Name and Status from VRS. See Line Setup - Edit Line to change the designated printer. Clicking on the printer name will open the VRS Link website.
- Product: Product name and description or product image.
- Shift: Displays the current shift and shift hours.
-

Clicking the QA button will bring up the QA Count dialog box.
-

Clicking the Product button brings up the Assign a Product dialog box. See Assign a Product to a Line.
-

When the printer print count does not increase (no product passes print head) for 5 minutes, the Line Status will display Stopped and the Enter Downtime Reason button will display on the Line Dashboard page.
Initial Entry Time is Limited
The Enter Downtime Reason button only displays up to 5 minutes after the line comes back up (Line Status goes from Stopped to Running). After the Enter Downtime Button goes away, that downtime will show as Unknown.
-
-
Second Line
-
Running: Current Line State and Time.
There are four states: Running, Break, Maintenance, and Stopped.
-
Running : Line is running. Printer is printing on products and print count is increasing at least once every 4 minutes and 59 seconds.
-
Break/Maintenance : Planned Events. See Shift Setup, Create an Event or Edit an Event to see how to create or edit a Planned Break or Maintenance Event.
-
Stopped : Unplanned Downtime. Stopped will display anytime the printer print count does not increase within 5 minutes. The
button will then display.
-
- Shift Count: Total product count so far for the Line's current shift.
- Last Hour: The product count for the last hour.
- Current Hour: The product count so far for this hour.
- OEE: displays the Line's OEE at the current time.
-
Rate:
Displays Run Rate as a 5-minute rolling average, projected out to a one-hour period to be consistent with how throughput targets are set and displayed. The rate display is color coded based on both Run Rate and Best Rate.
If in Downtime, run rate = 0.
Color Code Values:
- Red = rate is significantly below Target Run Rate [?]rate = 0-50% of Target Run Rate
- Orange = rate is below Target Run Rate [?]rate = 50% -99% of Target Run Rate
- Black = rate is at Target Run Rate [?]rate < [target + (best-target)/2]
- Green = rate is exceeding Target Run Rate [?]rate ≥ [target + (best-target)/2]
- Violet = rate is exceeding the Best Rate [?]rate > Best Rate
-
-
Shift Targets Graph & Timeline
Displays the Best Hour Rate Prediction, Current Rate Prediction, Target Production, and Actual Production.
-
Shift Target Graph
The Shift Target Graph is a Burn-down Chart that shows at a glance the comparison of four production rates to help the user quickly determine the efficiency of the line and if they are on schedule. These rates are color coded and indicated in the legend at the bottom of the chart. Hover the cursor over a Legend to highlight that line.
-
Shift Target - Timeline
Shows the Shift Timeline for the current shift
Timeline color codes:
Green = Running
Light Green = Slow Cycle Running
Yellow = Scheduled Event (including Autostandby)
Red = Unplanned Downtime
Light Red= Microstop (less than 5 minutes)
Black = Disconnected (printer disconnected from VRS)
Blue = Remaining Shift.
See Shift Setup - Create an Event or Edit an Event to add or edit shift events.
-
-
Shift Production Information
A consolidated list of Count information by current shift.
- Units Ahead/Behind: The product count ahead or behind the target rate.
- Time Ahead/Behind: The time ahead or behind meeting the target rate by the end of the shift.
- Unit Chart: Displays the actual unit count so far for this shift and the remaining units to be produced for that shift. This count is based on the target rate. Hover the cursor over a Graph Line will show the detail actual or remaining count.
- Target Units: Total Target Rate Product Count for the current shift.
- Estimated Units: Total estimated product count for the current shift based on the Current Production Rate.
- Target Time: The Shift End Time.
- Estimated Time: The estimated time that the production will take to complete.
- Time Ahead/Behind: The time ahead or behind meeting the target rate by the end of the shift.
-
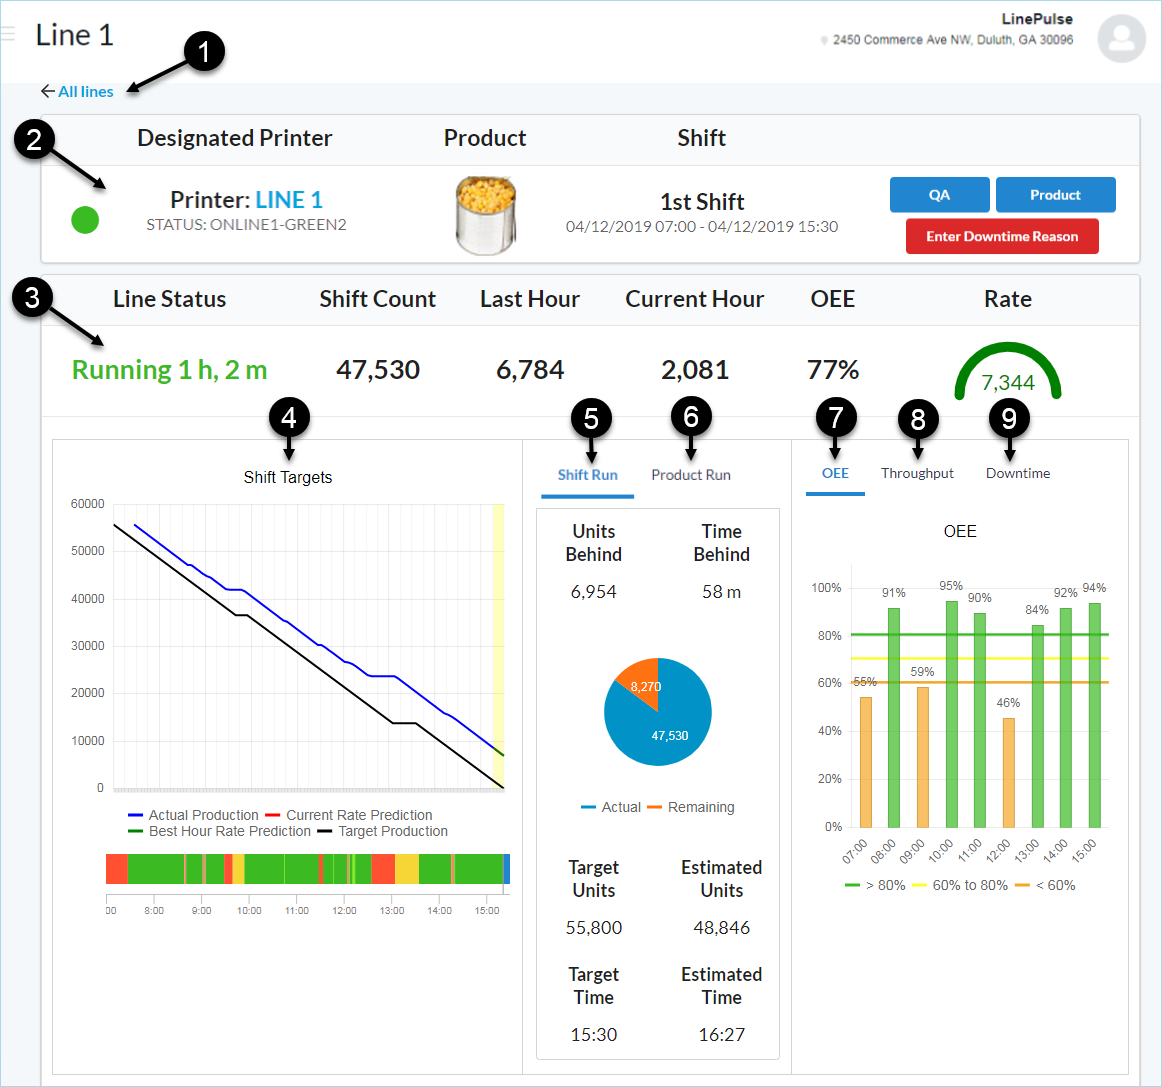
Product Production Information
A consolidated list of Count information by current product.
- Production Target: The Production Target is based on the Product Count set with the Product Button in #2 above.
- ETC: The Estimated Time of Completion.
-
Product Count Chart: Displays the actual product count so far for this shift and the remaining product to be produced for that shift. This count is based on the Product Count set by clicking on the Product Button (#2 above). Hover the cursor over a Graph Line to show the detail actual or remaining count.
- Note: The Production Target, ETC, and Product Count Chart will only display if a Product Count is set for this line
-
OEE
Color coded graphical display by hour of the OEE for the current shift.
Green = 95%
Yellow = 90%
Orange = less than 85%
-
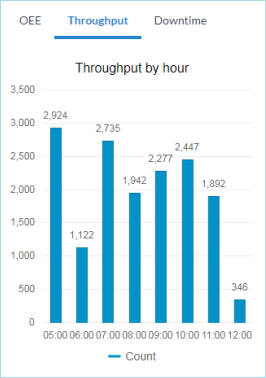
Throughput
A graphical display of Product Count by hour. Hover the cursor over a Graph Line to show the detail count for that hour.
-
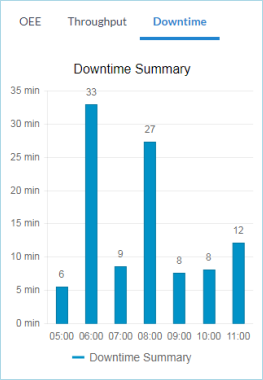
Downtime
Graphical display of the minutes of Downtime by hour. Hover the cursor over a Graph Line to show the detail downtime minutes for that hour.